

Extreme weather conditions inspire learners to study climate data
|
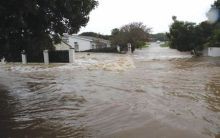
In October 2012, the Eastern Cape experienced heavy rains, which resulted in severe floods and damage in places.
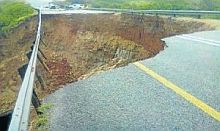
Houses and roads were washed away. A section of the N2 between Grahamstown and Port Elizabeth collapsed, cutting of access between the two cities. The heavy rains also led to a number of incidents that posed danger to the community, such as trees falling on houses and vehicles, and power lines collapsing.
Weather stations
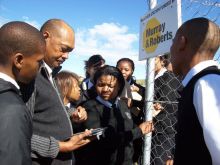
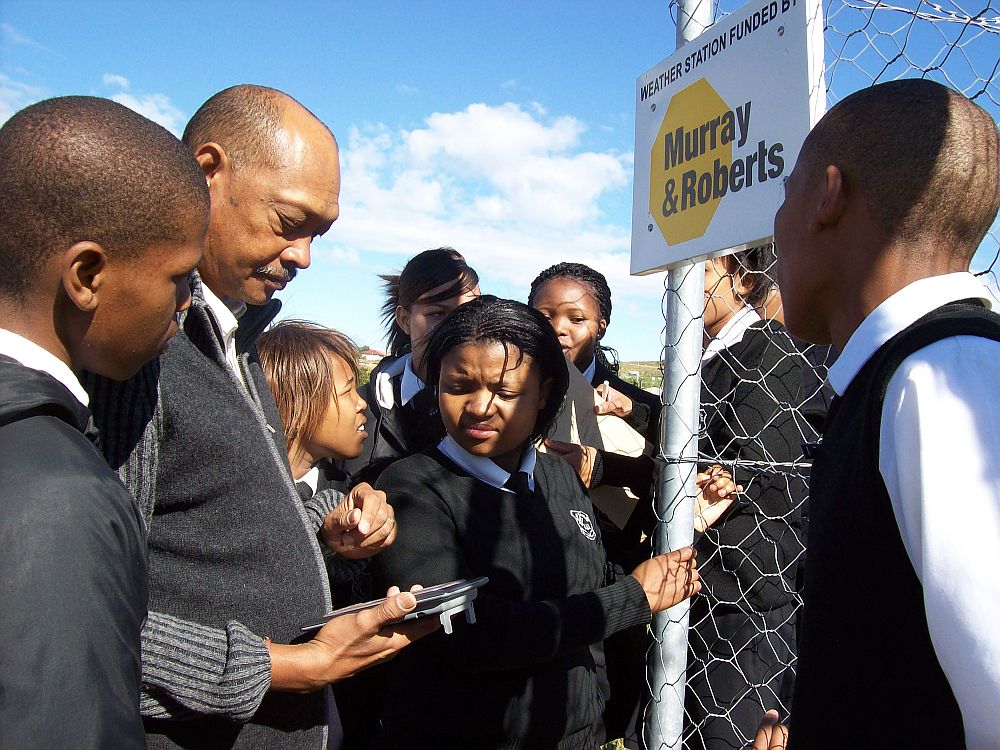
In 2009, the SAEON Elwandle Node erected weather stations at a few schools around Grahamstown to measure and record atmospheric conditions such as temperature, wind direction, wind speed, humidity, pressure and rainfall.
The week-long heavy rain sparked curiosity in the learners involved with weather and climate monitoring at schools equipped with climate monitoring equipment. The learners get real time data and they checked how much rainfall they were getting on a daily basis in the weather stations.
The weather stations, which were sponsored by Murray & Roberts, are set up to measure and record data at 15-minute intervals. Learners studying climate data recorded at their respective schools learn that weather varies from hour to hour, day to day and season to season. Learners are also able to see that weather varies on local spatial scales. Scientific enquiry abilities are gained through analysing data collected by means of the weather stations.
Below is a comparison of the five-day total rainfall recorded at participating schools and data received from the South African Weather Service:
|


