
Studying the impacts of another year of drought in the south-western Cape
|


"If we are to reduce the consumption to 700 million litres of collective use per day at the current evaporation rates in dams, we could be looking at approximately 135 days of useable water left."
- The City of Cape Town, 14 February 2017
"We have 121 days left of usable water in our dams."
- Cape Town Mayor Patricia de Lille, 2 March 2017
While the two-year drought in the summer rainfall area of South Africa seems to be over now, and flooding is of more immediate concern, the south-western Cape is battling to survive the next few months as dams empty and rainfall remains elusive. This region receives most of its rain in the winter months.
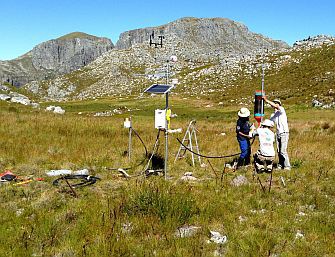
SAEON long-term monitoring
The last time SAEON’s high-elevation rain gauge at Dwarsberg above the Jonkershoek valley recorded rainfall close to the long-term average was in 2013 (3184 mm).
|
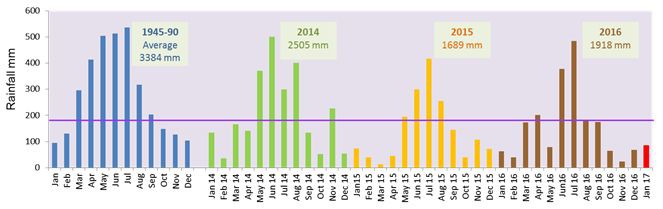
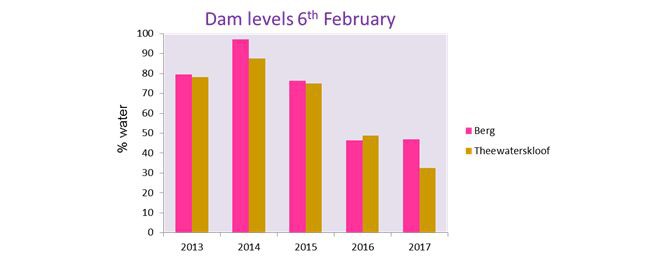
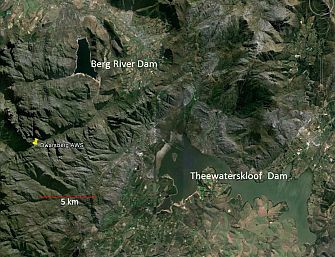
Although the rainfall in 2014 was below average, the dams managed to fill up to 100% during winter and hold this water through the summer months. But two years of poor rainfall in 2015 and 2016 have emptied the dams. The Theewaterskloof and Berg River Dams, those closest to the Dwarsberg catchment, are emptier now than they were this time last year.
|
Without a large influx of water in the past winter, we are now relying more on the low streamflow in summer to keep Cape Town and surroundings supplied with water until the hoped for rains materialise in autumn. SAEON’s streamflow data from the small Langrivier catchment near to Dwarsberg shows that the total volume of water flowing for October-January is at the lowest yet for the last six years (2013/14: 2171 million litres, 2016/17: 660 million litres).
|
Langrivier is fairly typical of the streams currently feeding the dams. To put this in perspective, Cape Town just managed to drop its water usage to its target of less than 800 million litres per day at the end of January. In mid-February they revised the target consumption to 700 million litres per day, which is anticipated to provide water for a further 135 days if good rains don't come in the meantime.
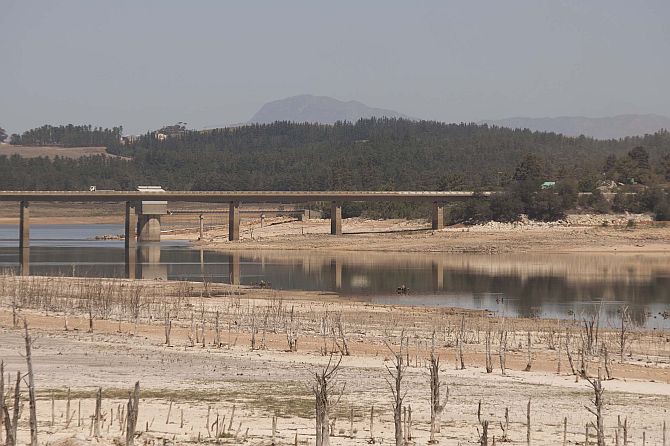
The taps may indeed run dry
For the coming period to June, weather projections presented by the South African Weather Service are uncertain since forecasts for the south-western Cape have a “no better than chance” probability of occurring. If rains don’t return to normal levels in the next few months, the taps may indeed run dry.
|
While these rainfall patterns are concerning for their social and economic impacts, SAEON is hoping to learn more about the influence of extreme climate conditions on catchment hydrology and fynbos vegetation recovery following the wild fires that have occurred over the last few summers. Research has shown that fynbos does recover following drought (West et al., 2012).
The current dry period recorded at Dwarsberg is the worst since records started in 1945 (although we are uncertain as to condition in the period 1990-2013). If drought is prolonged under future climate regimes will fynbos experience a change of state or will its resilience during the highly variable late Pleistocene ensure its survival?
These are some of the questions SAEON scientists hope to answer using data from repeat vegetation surveys and our fine-scale weather-monitoring networks.
Further reading
City of Cape Town Dam levels:
SAEON Fynbos Node Drought Monitor: http://rpubs.com/jslingsby/176051
South African Weather Service seasonal projections: http://www.gfcsa.net/SAWS/saws.pdf
AG West, TE Dawson, EC February, GF Midgley, WJ Bond, TL Aston. 2012. Diverse functional responses to drought in a Mediterranean‐type shrubland in South Africa. New Phytologist 195 (2), 396-407.
Acknowledgements
The Department of Environmental Affairs (Natural Resource Management Directorate) and the Department of Science and Technology are supporting SAEON’s weather and streamflow monitoring network