
Investigating internal waves in Algoa Bay
|

By Dr Wayne Goschen (SAEON Egagasini Node), Dr Marjolaine Krug (CSIR, UCT), Mr Xolisa Dlomo (SAEON-NMMU PhD student), Dr Tommy Bornman and Dr Shaun Deyzel (SAEON Elwandle Node)
Internal waves in the ocean occur at surfaces of different densities (i.e. at the interface) in the water column and are found in layered or continuously stratified seas. Stratification (e.g. temperature change with depth) is necessary for the waves to propagate.
The most common interface to identify internal waves is the thermocline, where there is a sharp vertical temperature gradient, but they may also occur at haloclines such as is common in coastal waters. Internal waves may be generated at the air/sea interface (atmospheric pressure and wind systems), at bottom obstacles or lateral boundaries (e.g. capes) and from the interior of the ocean at the shelf break, for example the Agulhas Current.
Role in local food chain
Internal waves are important for marine ecosystems because nutrients, phytoplankton, copepods and larvae are uplifted nearer to the surface at the crests of the internal waves. This will also be a place of high chlorophyll concentrations where zooplankton grazing is most effective. Thus high concentrations of biomass will be associated with the crests of internal waves and low biomass concentrations with the troughs.
Internal waves are likely to play a role in the local food chain, but their influence is yet to be determined in the Algoa Bay region. SAEON’s Dr Tommy Bornman and Dr Shaun Deyzel will investigate the biology associated with internal waves.
Signature of internal waves observed
Oscillations in temperature records at periods of between 2.5 hours and 21.4 hours (the inertial period), which appear to have the signature of internal waves, have been observed in the deeper (bottom depth > 60 m) SAEON underwater temperature records (UTRs) array in Algoa Bay. These events have not been fully investigated since this project is in its infant stage, but a start has been made in identifying periods of internal wave activity in some records.
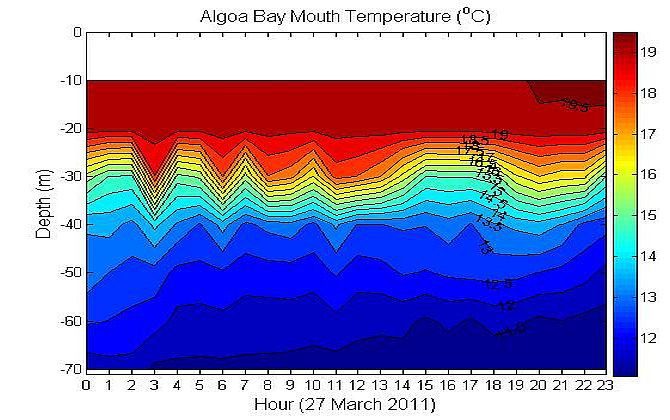
Figure 1 shows one such event on 27 March 2010. Internal waves with period of about three hours were recorded by the Algoa Bay Mouth UTR string (Figure 2) moored near the mouth of Algoa Bay (between Cape Recife and Cape Pardone) in 80 m bottom depth. During that period the thermocline lay at a depth of about 30 m, below a well-mixed upper layer at a temperature of 19 °C, and oscillated with a vertical displacement of 5-10 m during the morning of 27 March.
|
On the radar
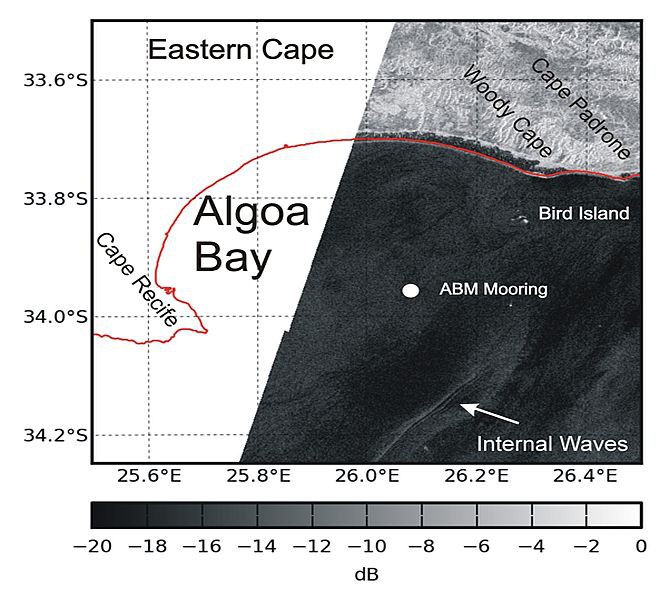
Orbital motions associated with internal wave propagation cause regions of converging and diverging flow at the ocean's surface. In Synthetic Aperture Radar (SAR) satellite images, internal waves manifest themselves on the sea surface as alternating bands of rough and smooth water, which appear as light and dark strips on the image (top right).
Figure 2 is a SAR image of an internal wave train off Algoa Bay on 18 November 2007. The internal wave is thought to have been generated at the shelf edge by the Agulhas Current. Although no measurements were made during this time, it is likely that the wave train propagated north-westwards towards Algoa Bay. Several images showed similar surface structures near the shelf break off Algoa Bay. These lines of smooth and rough water may also be seen on the surface with the naked eye.
|
Gaining a deeper understanding of internal waves in the region
The knowledge of internal waves in the bays of the Eastern Cape, off the coastline and over the inner shelf over the eastern Agulhas Bank remains poor. This project aims to gain a deeper understanding of internal waves and internal tides in this region and then, in another parallel biological oriented project, to link the results to the spatial distribution of biological parameters. Xolisa Dlomo will investigate internal waves as part of his PhD.